Streamlining the drone mapping & processing experience @AEREO
Please Note : Due to confidentiality reasons, I cannot share the bulk of my work. Additionally, certain images/ deliverables have been obscured to preserve confidentiality. Thanks for your understanding!
Background
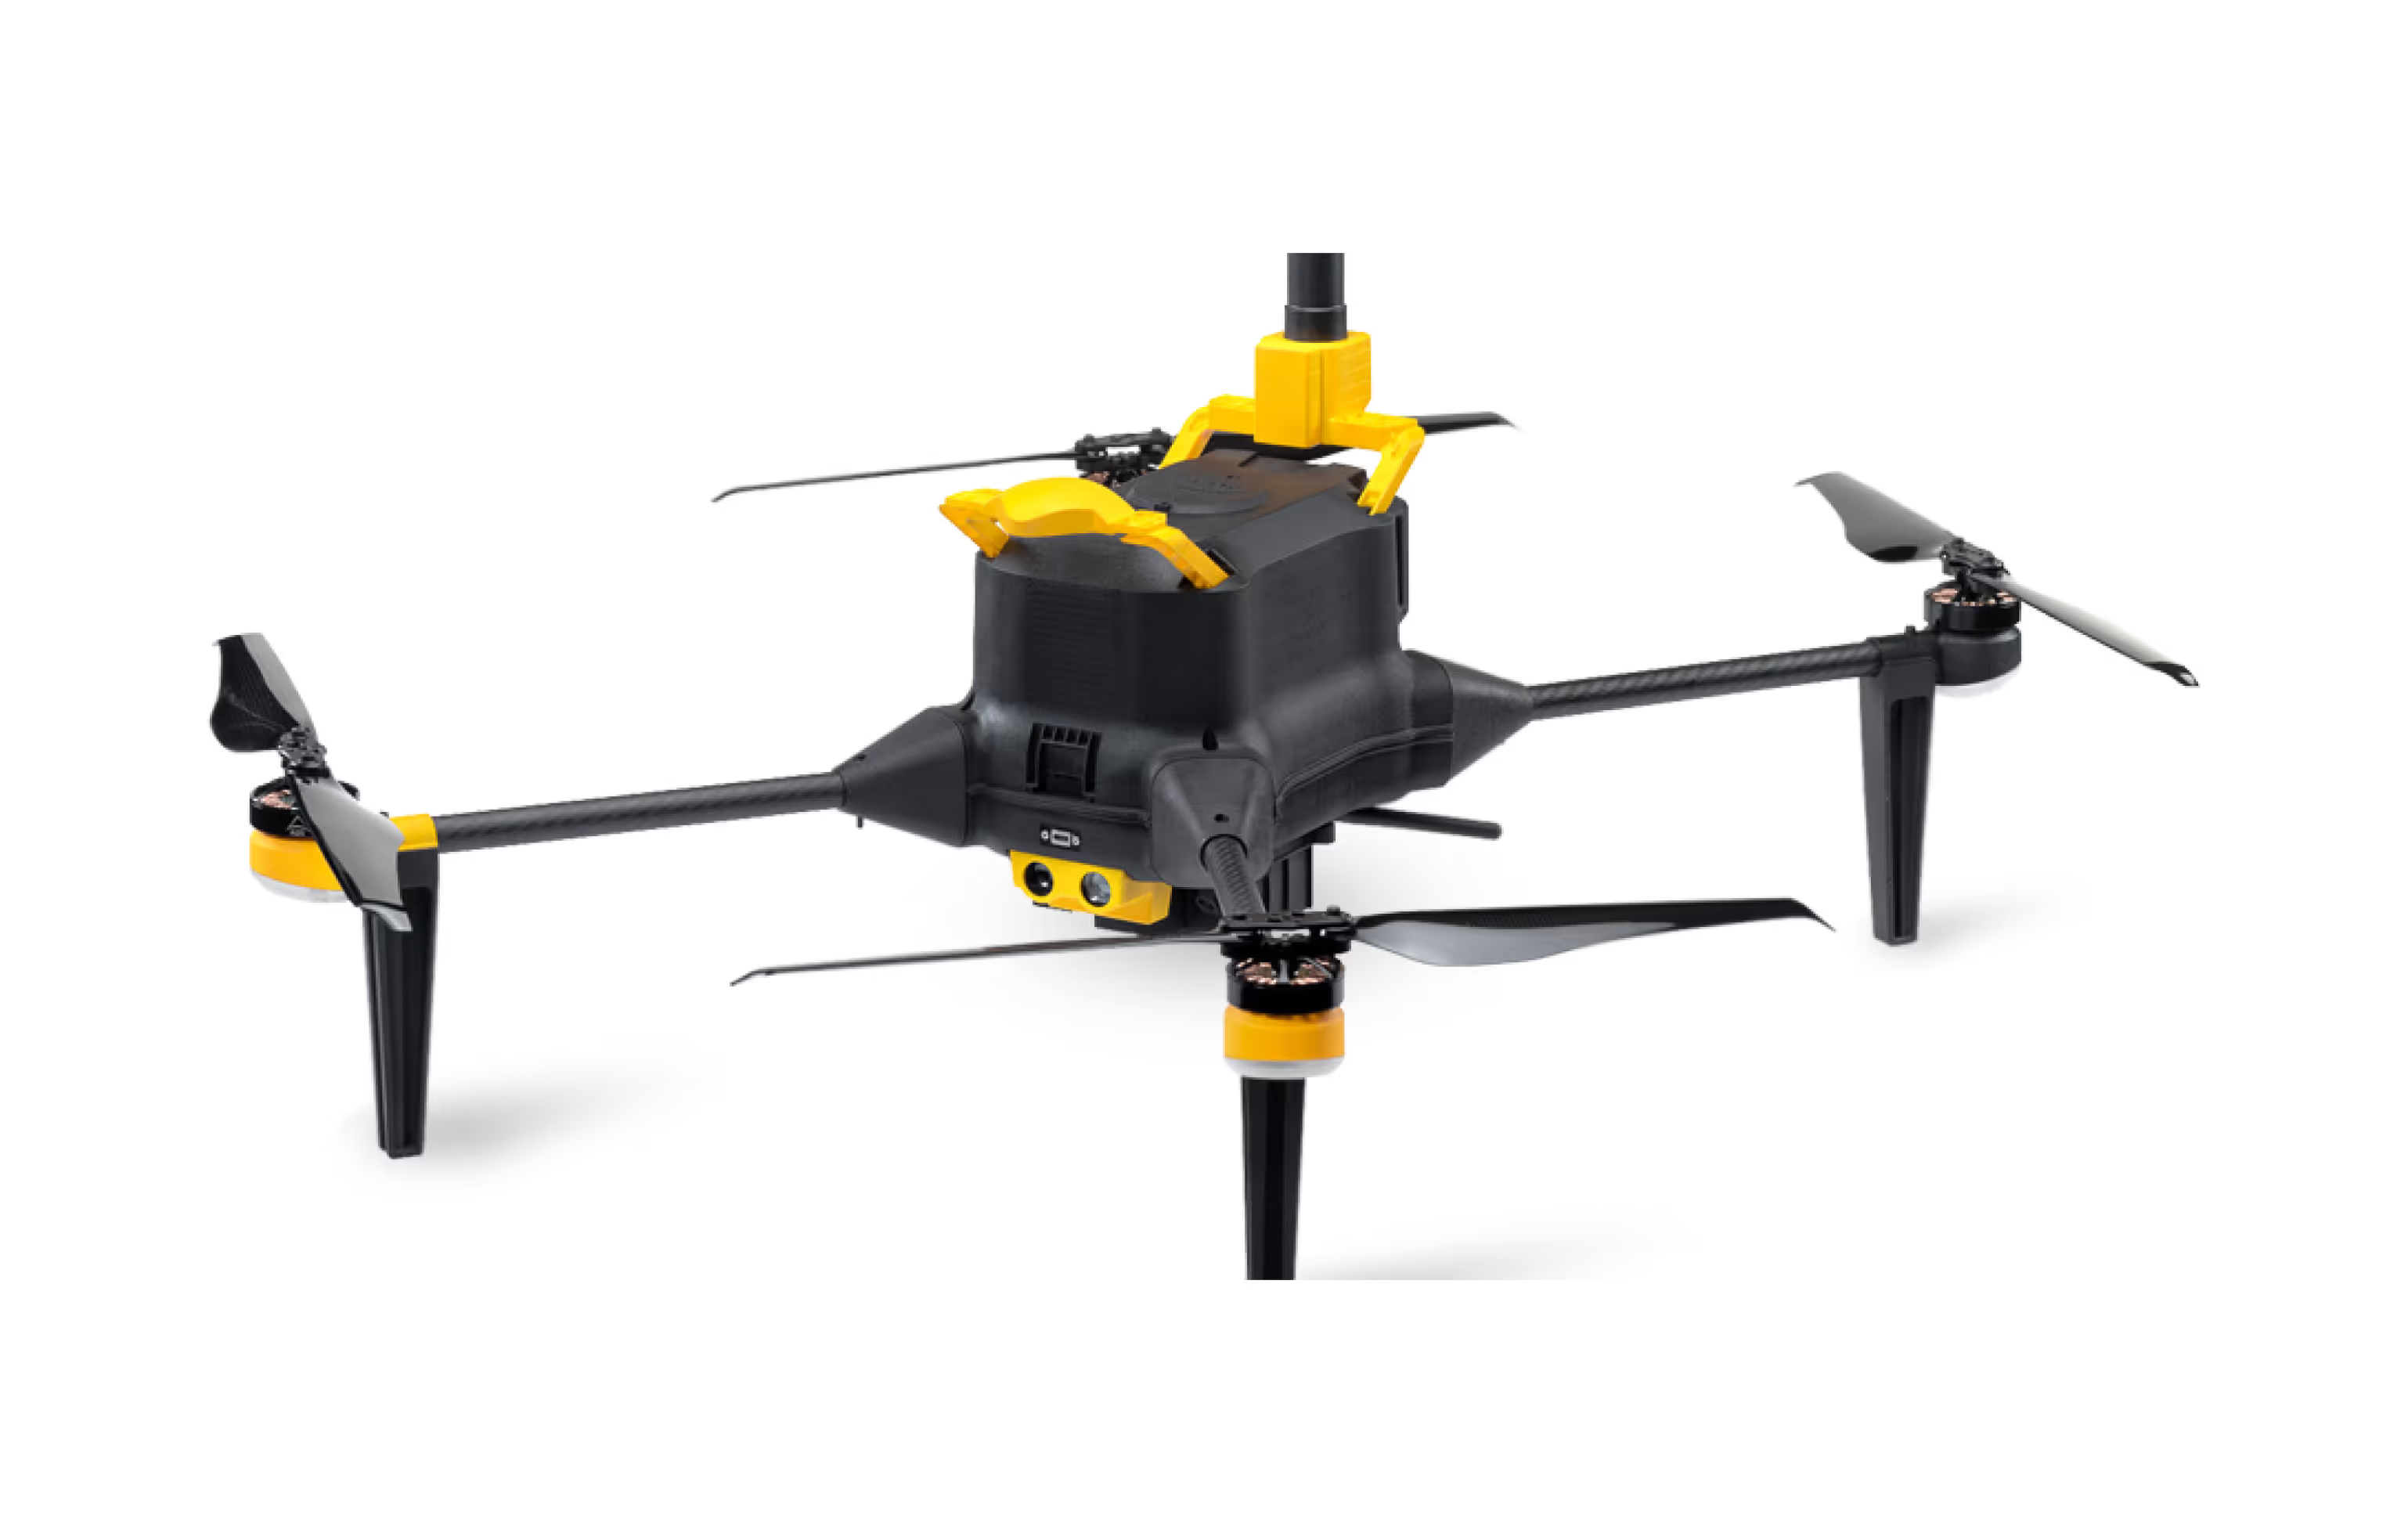
AEREO (prev. AUS) uses its drones to process and map surface data using a process called Photogrammetry. Now having acquired the biggest drone mapping project in the world by the Indian Government (more), AEREO had been tasked to map over 60,000 villages across India.
Problem
So far AEREO had been contracting small scale projects and were relying on 3rd party software but now they needed something bespoke in order to save costs, time as well as be more efficient. Additionally, outsourced software were not fully customized for the specific needs of the project, therefore AEREO wanted a customized end-to-end solution where :
Drone Pilots could upload the images/data captured by the drones
GIS (Graphical Information Systems) Analysts could process the data and run quality checks on the processed data
Data Processing Managers could verify and approve the mapped data.
Admins could manage and track all these activities.
Role & Responsibilites
Product Designer designing the end-to-end experience of the platform, with activities including:
Requirement analysis
Creating the design system
Competitor analysis
Information architecture
Low and high fidelity designs
Prototyping
Internal testing
Documentation, Demonstration and Handoffs
Duration & Team
Duration: 4 months
1 team lead/Project Manager
Product Designer (me!)
3 backend engineers
1 frontend engineer
Outcome
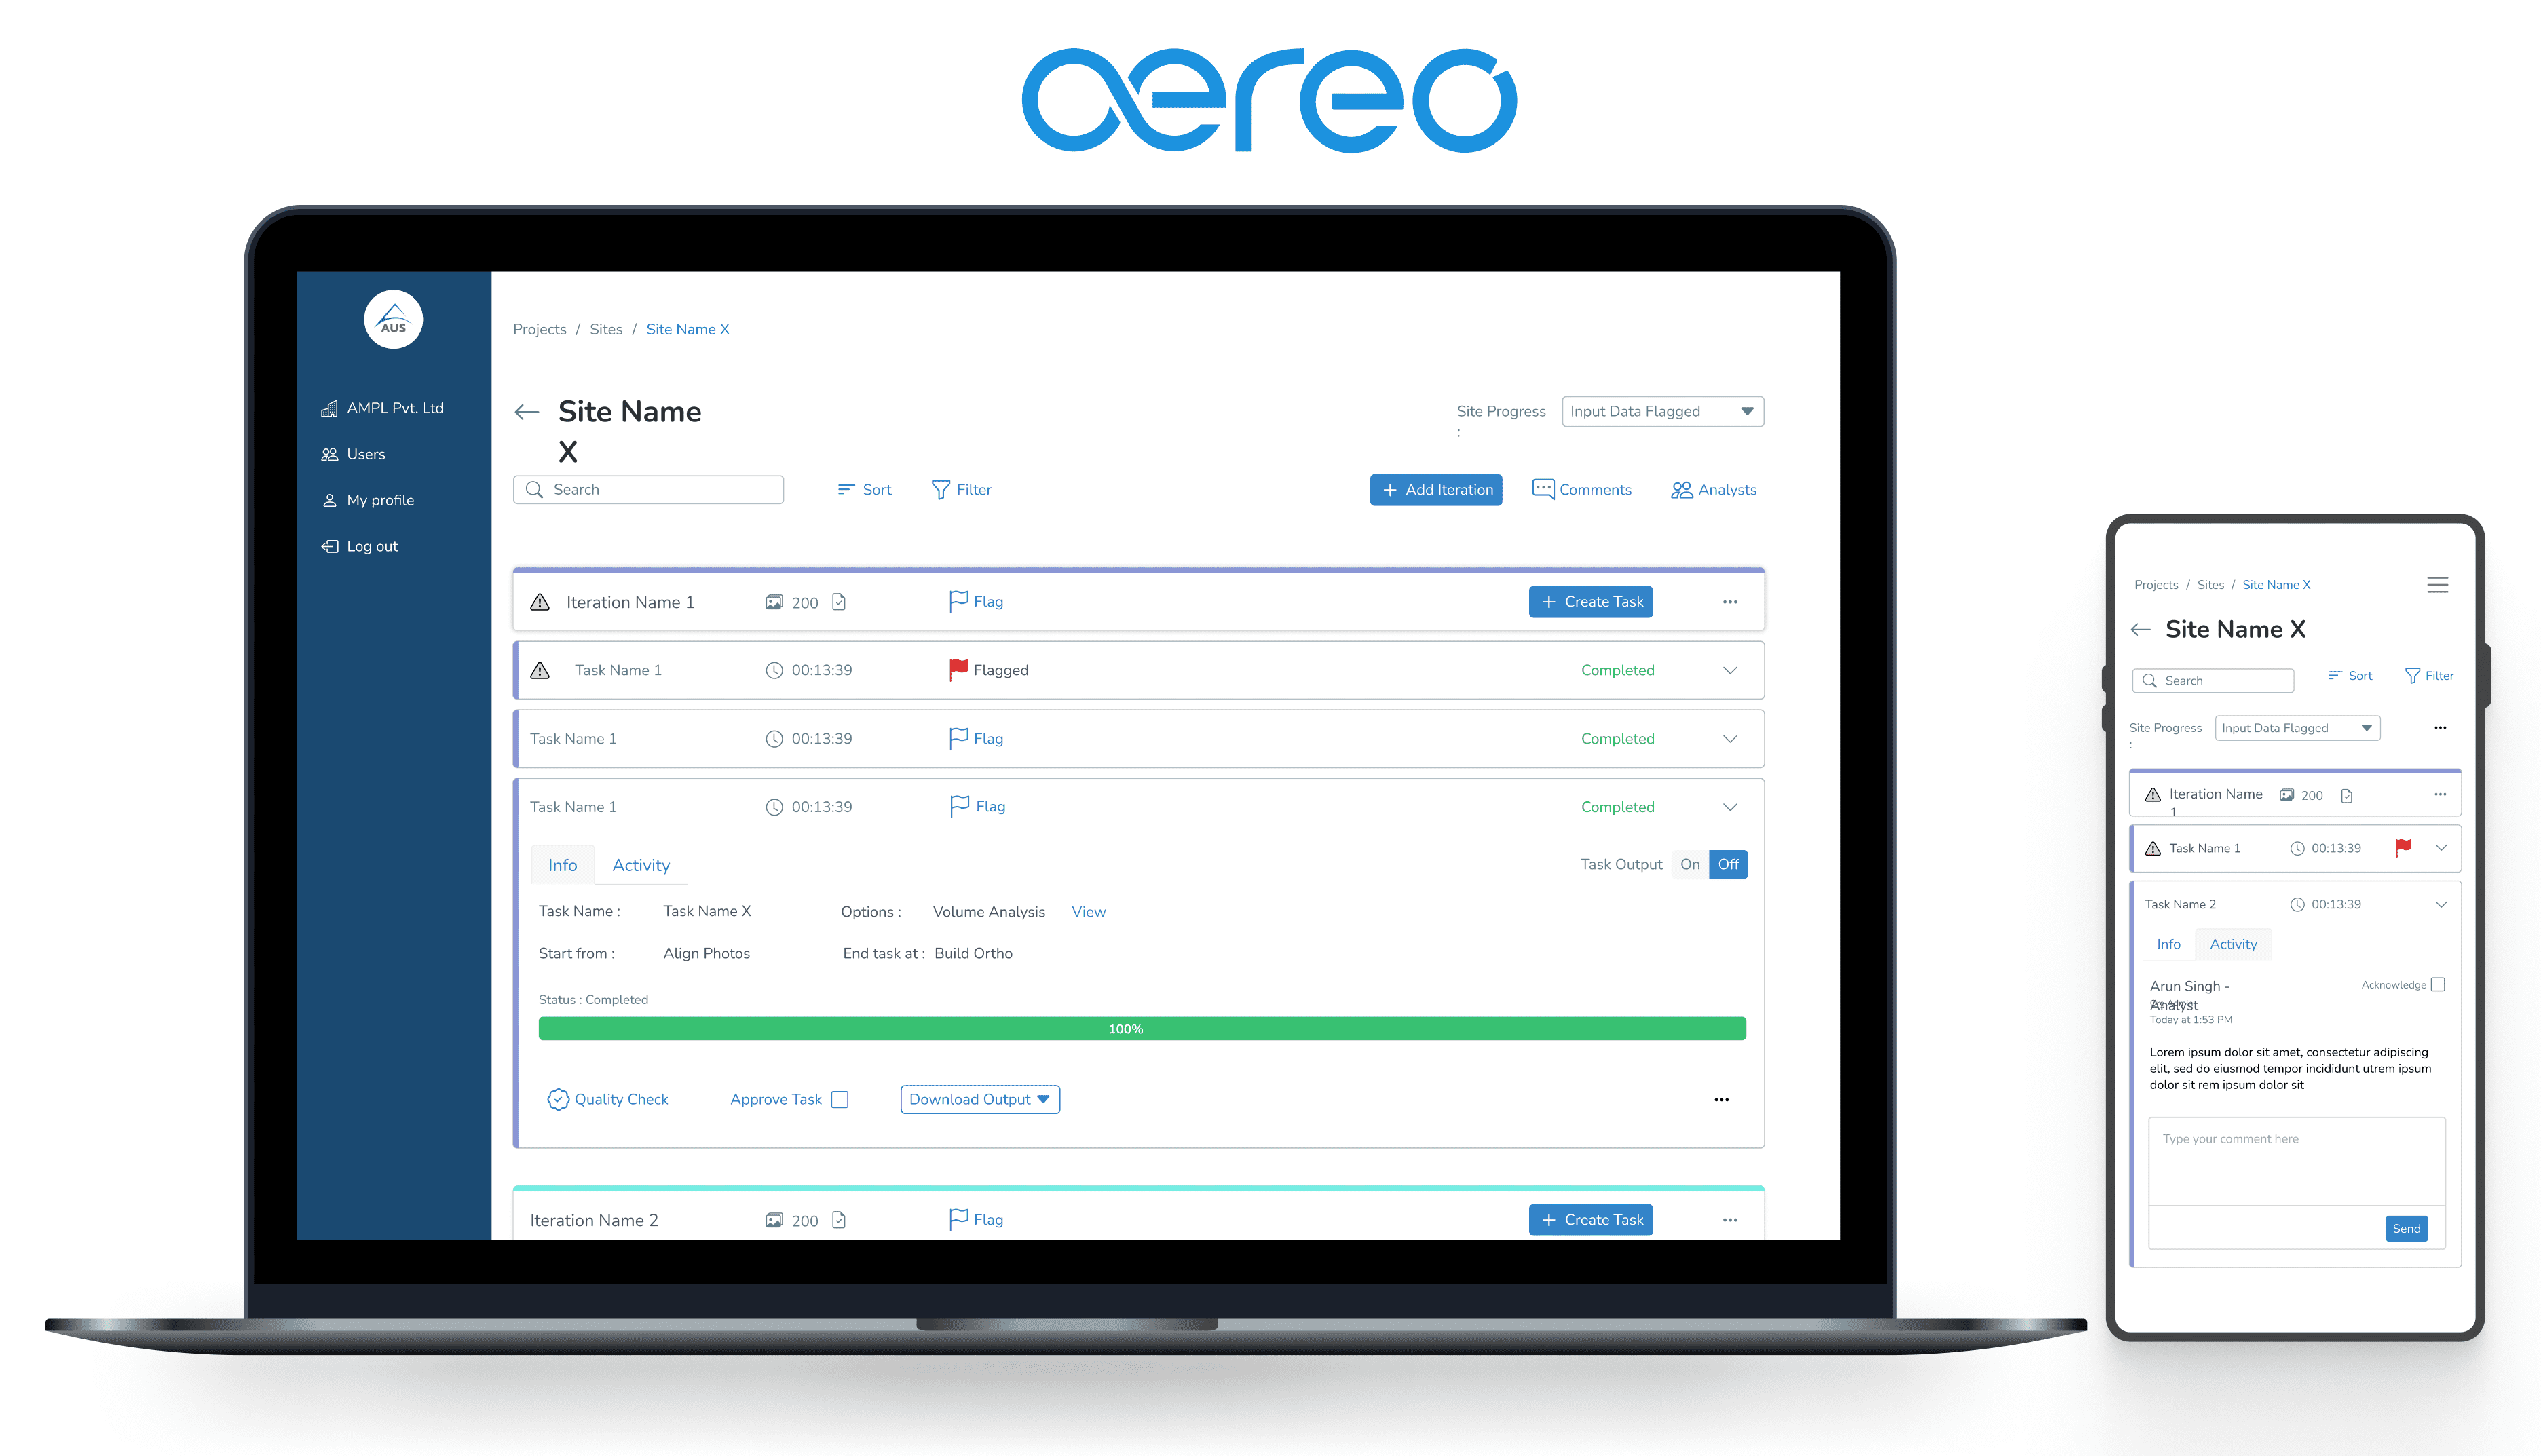
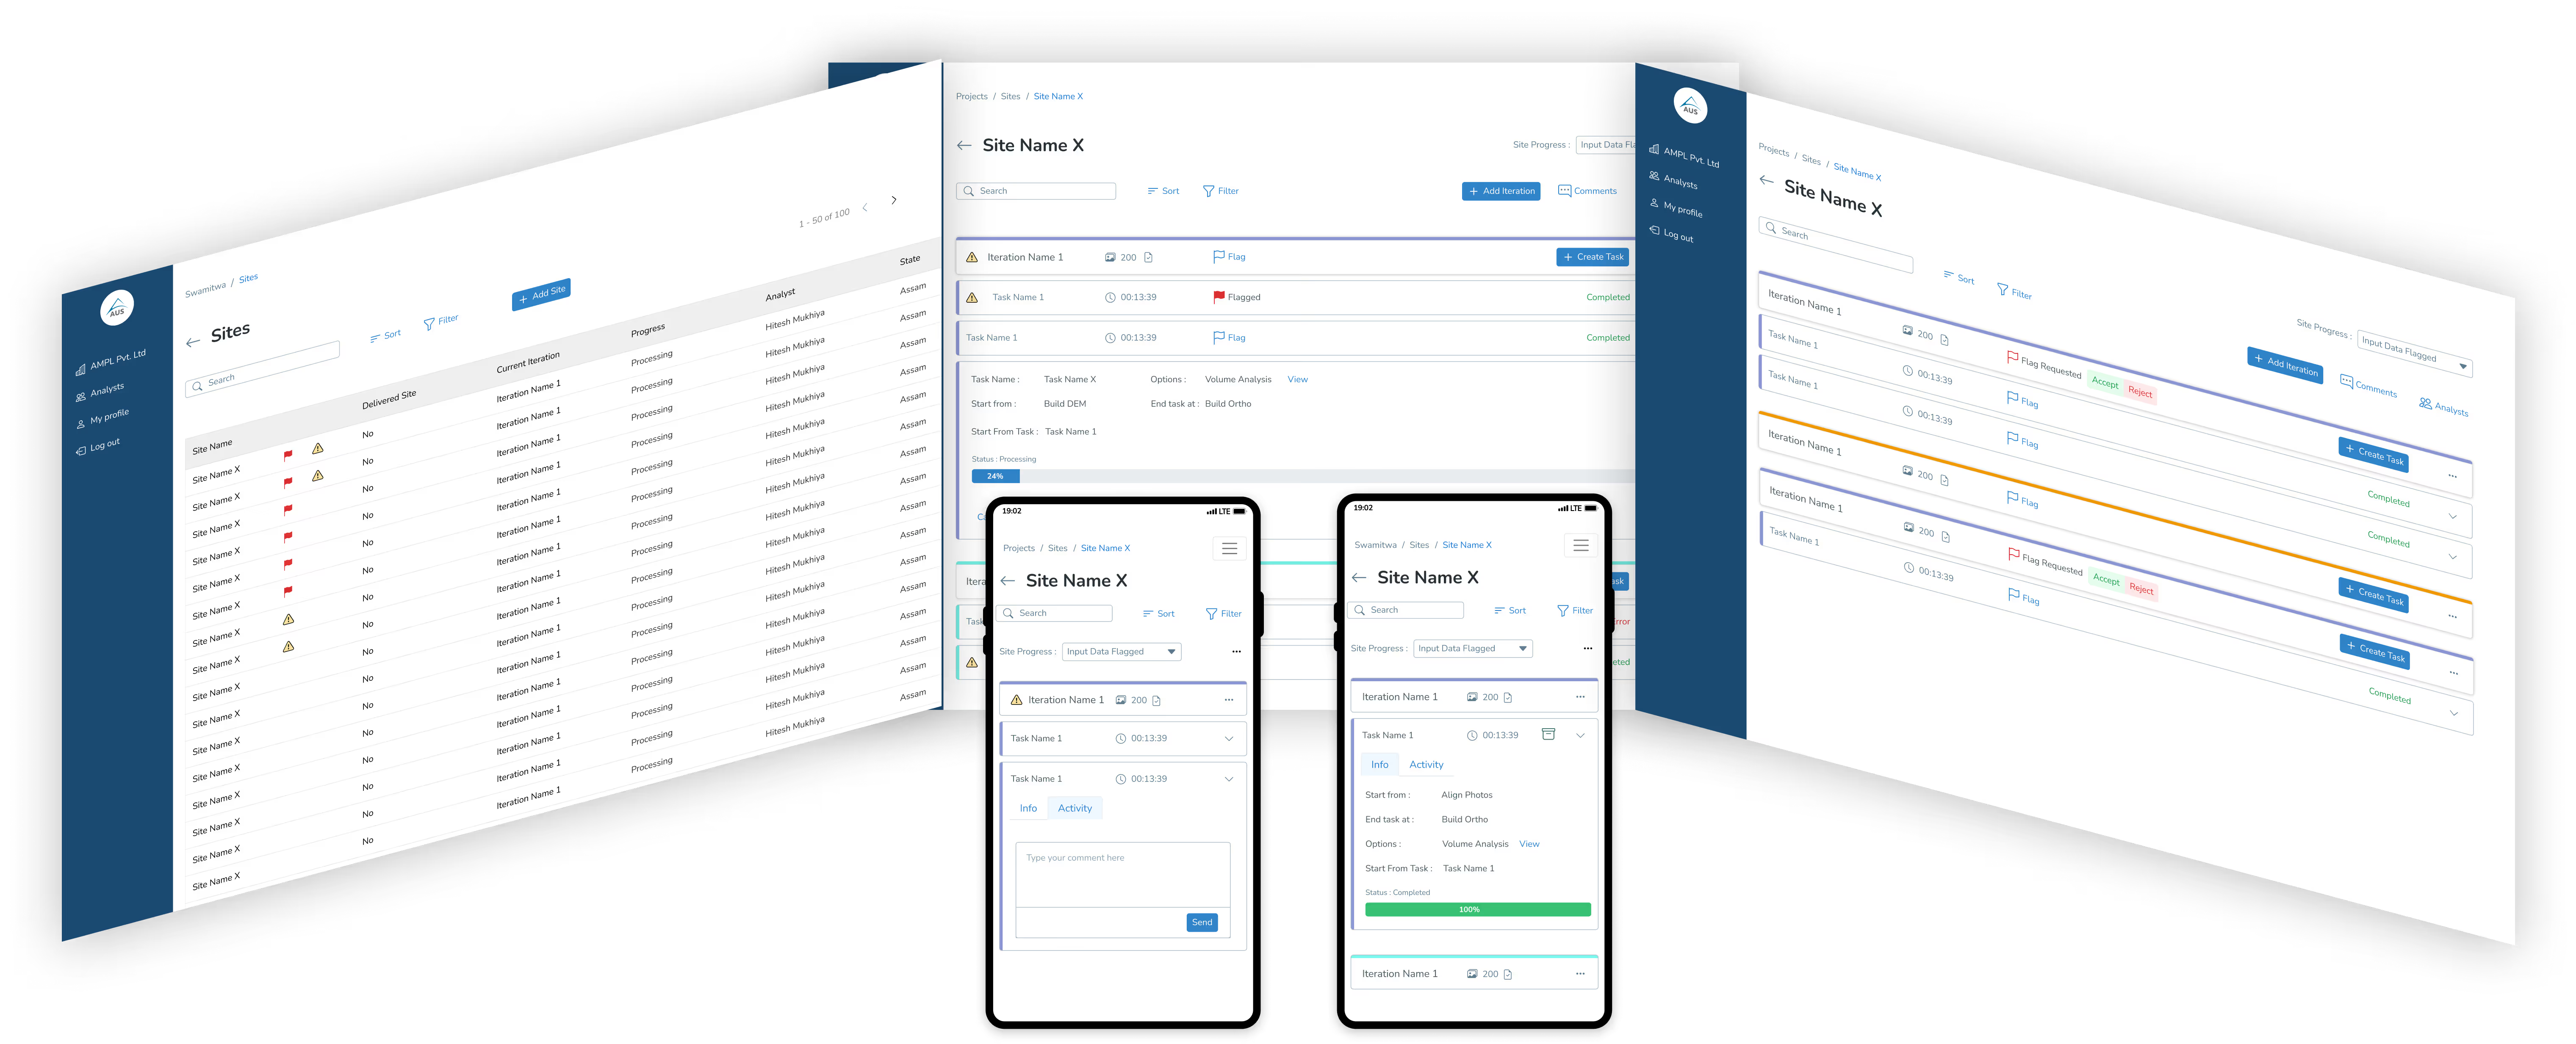
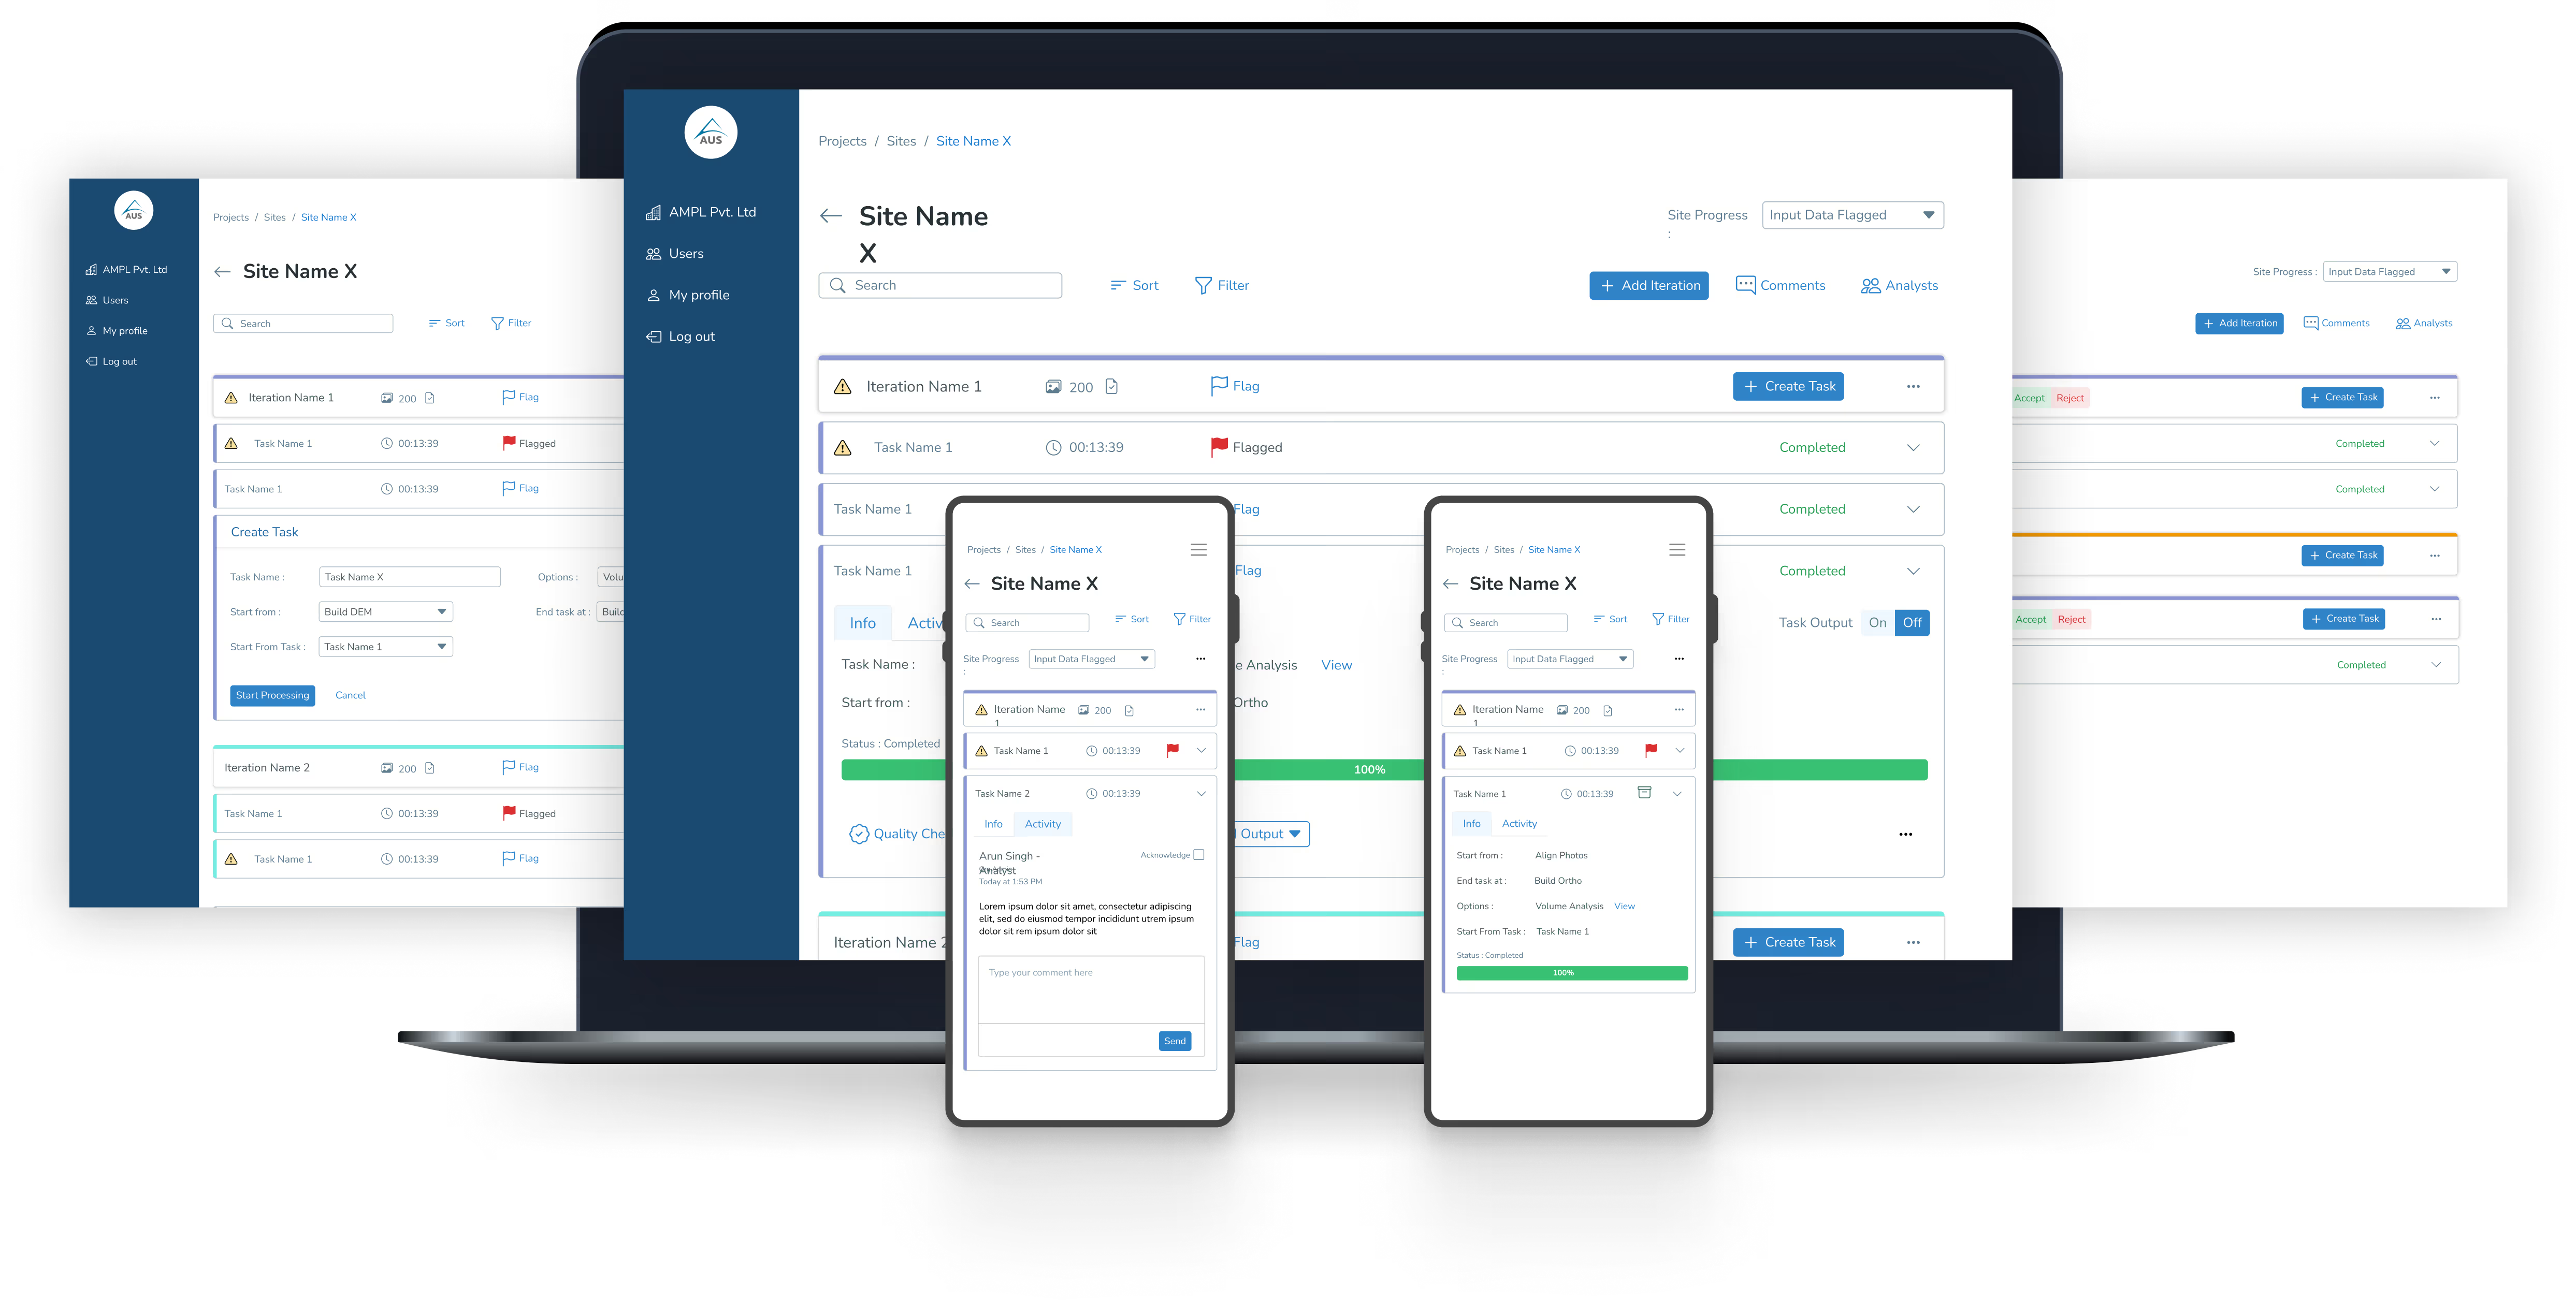
End-to-end design of a responsive drone mapping and photogrammetric tool & dashboard to help streamline the data processing, drone mapping, progress & activity tracking tasks for multiple users.
Approach
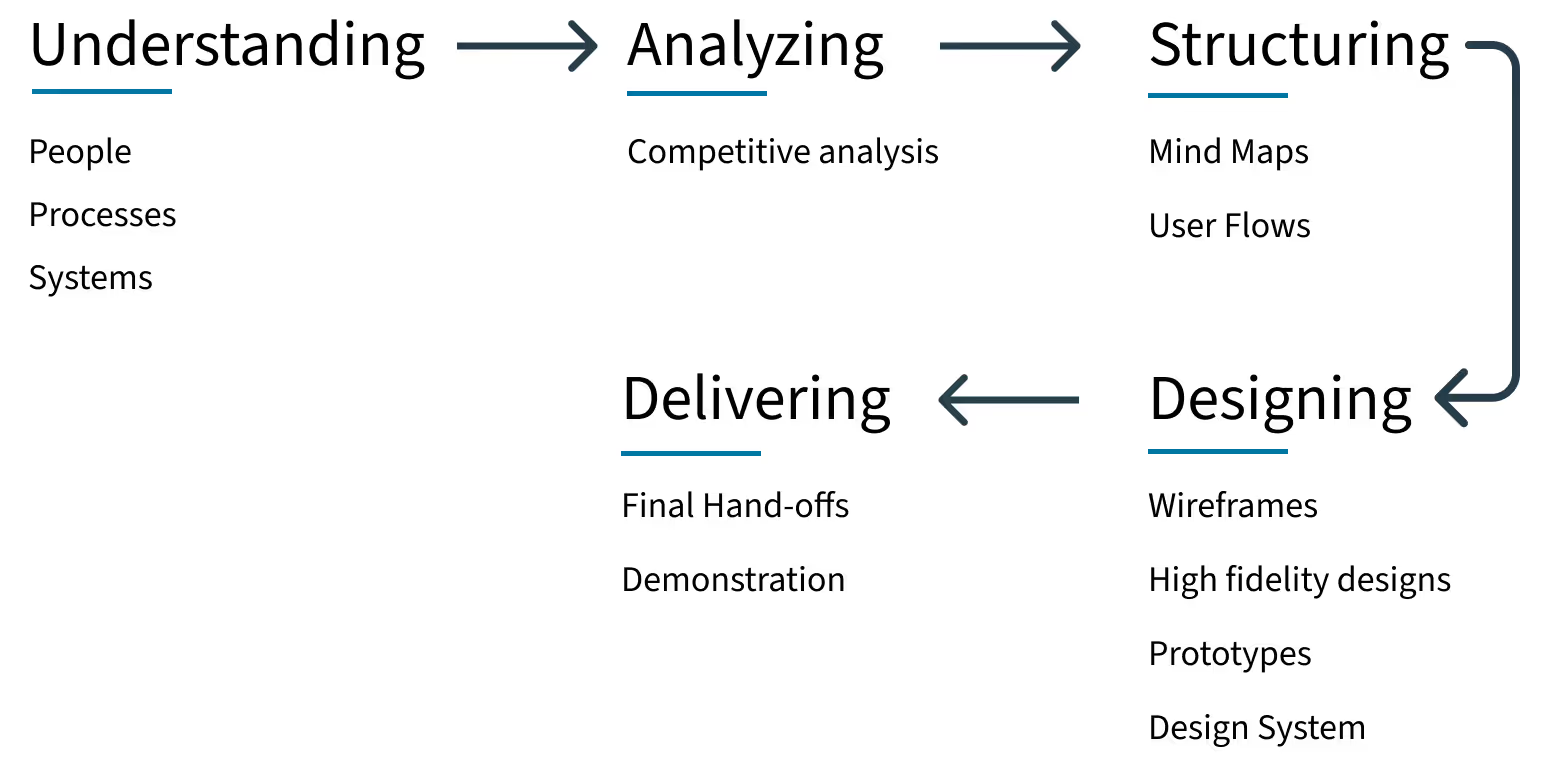
Understanding
People, Processes & Systems
I had to first understand how things worked at AUS, what was the nature of the project, limitations and the existing ecosystem.
People : The types of users and their tasks.
Processes : Technical understanding of the various GIS (Geographic Information System) processes such as mapping, processing, quality checking etc. and jargons such as sites, events, activities, flagging etc.
Systems : How different users support each other through interconnected processes to form a cohesive ecosystem.
Requirements
Then I had to understand the internal requirements laid out by AUS for the proposed solution that was in the form of a photogrammetry tool/dashboard. This was done through meetings with GIS analysts, team leads and stakeholders. Additionally, I had to crunch through some technical documentations.
Analyzing
Competitive Analysis
After gaining an understanding of the requirements, I collaboratively proceeded to audit existing photogrammetric software. This was done in order to figure out common:
Interaction patterns
Terms and jargons
User and task flows
Image blurred due to confidentiality reasons
The goal was to understand what software the existing users were used to, so that the new tool/dashboard doesn’t feel alien to the users.
Structuring
Creating the Information Architecture
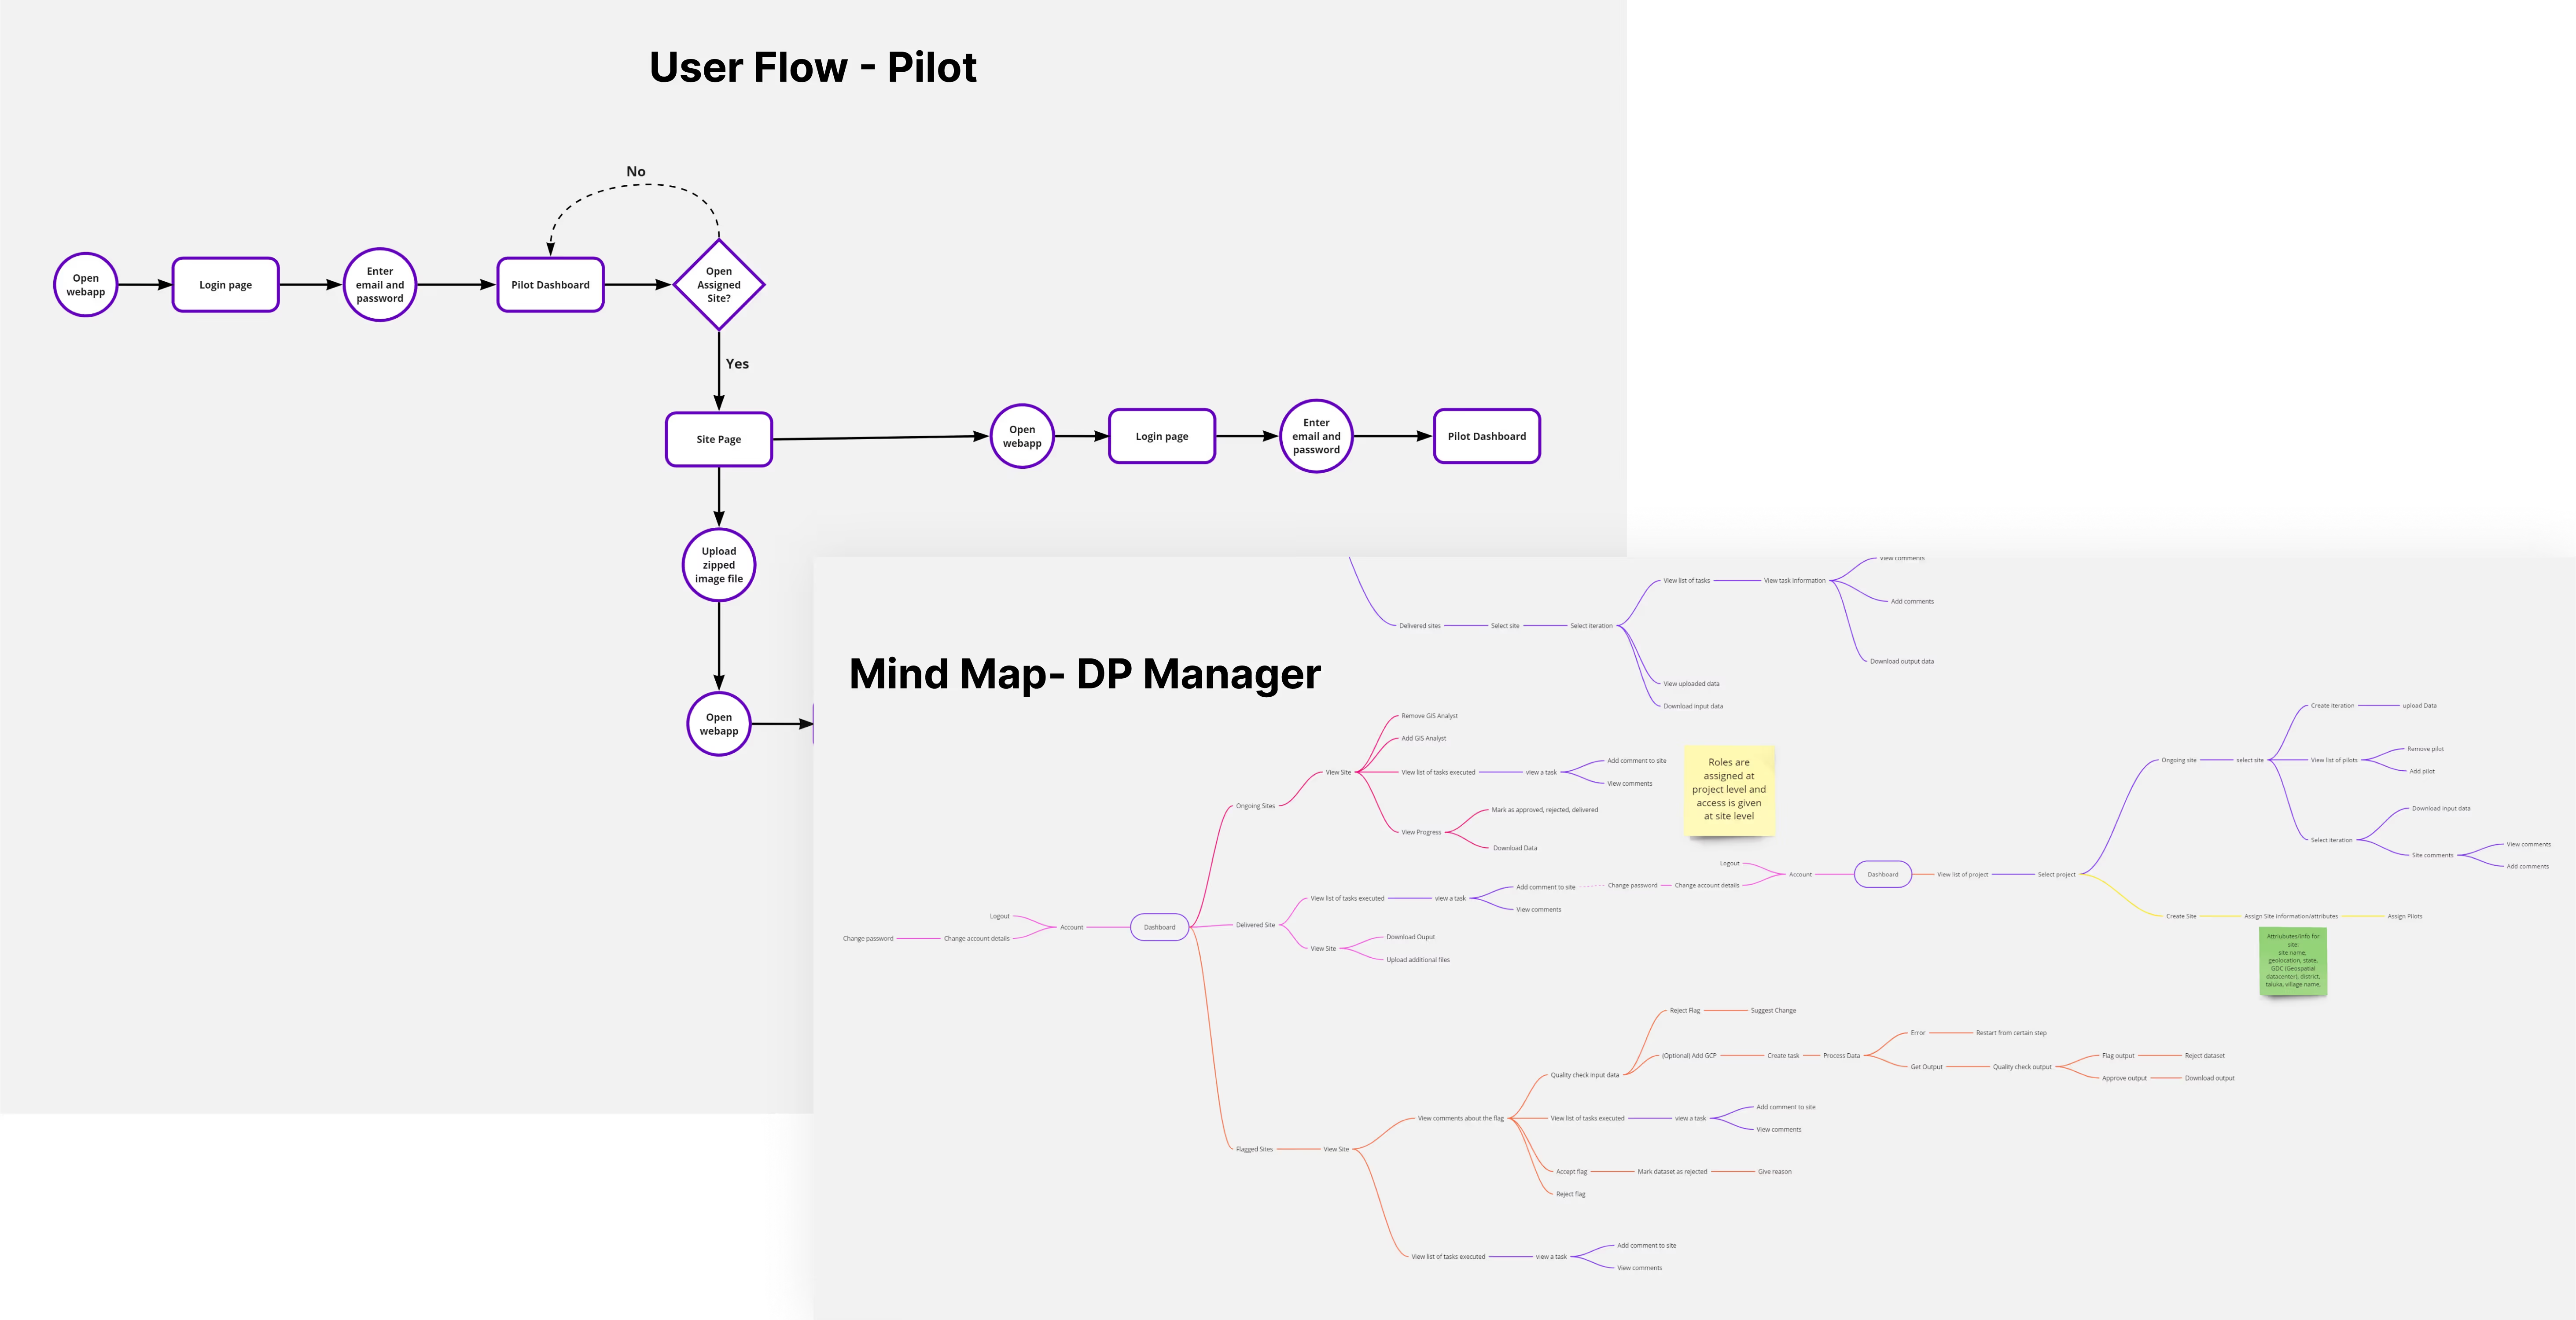
After gaining a good understanding of the software features to be designed, I had to structure how exactly things would be connected so as to make sense for different users. For that I utilized mind maps and user flows.
Mind Maps were utilized to systematically represent the complete workflow structure without getting lost in the complexity.
User Flows were created to flesh out all the different paths a user can take to achieve their goals. Various edge cases, error cases, happy paths were considered in the user flows.
Zoomed out due to confidentiality reasons
Designing
Wireframing & User Testing
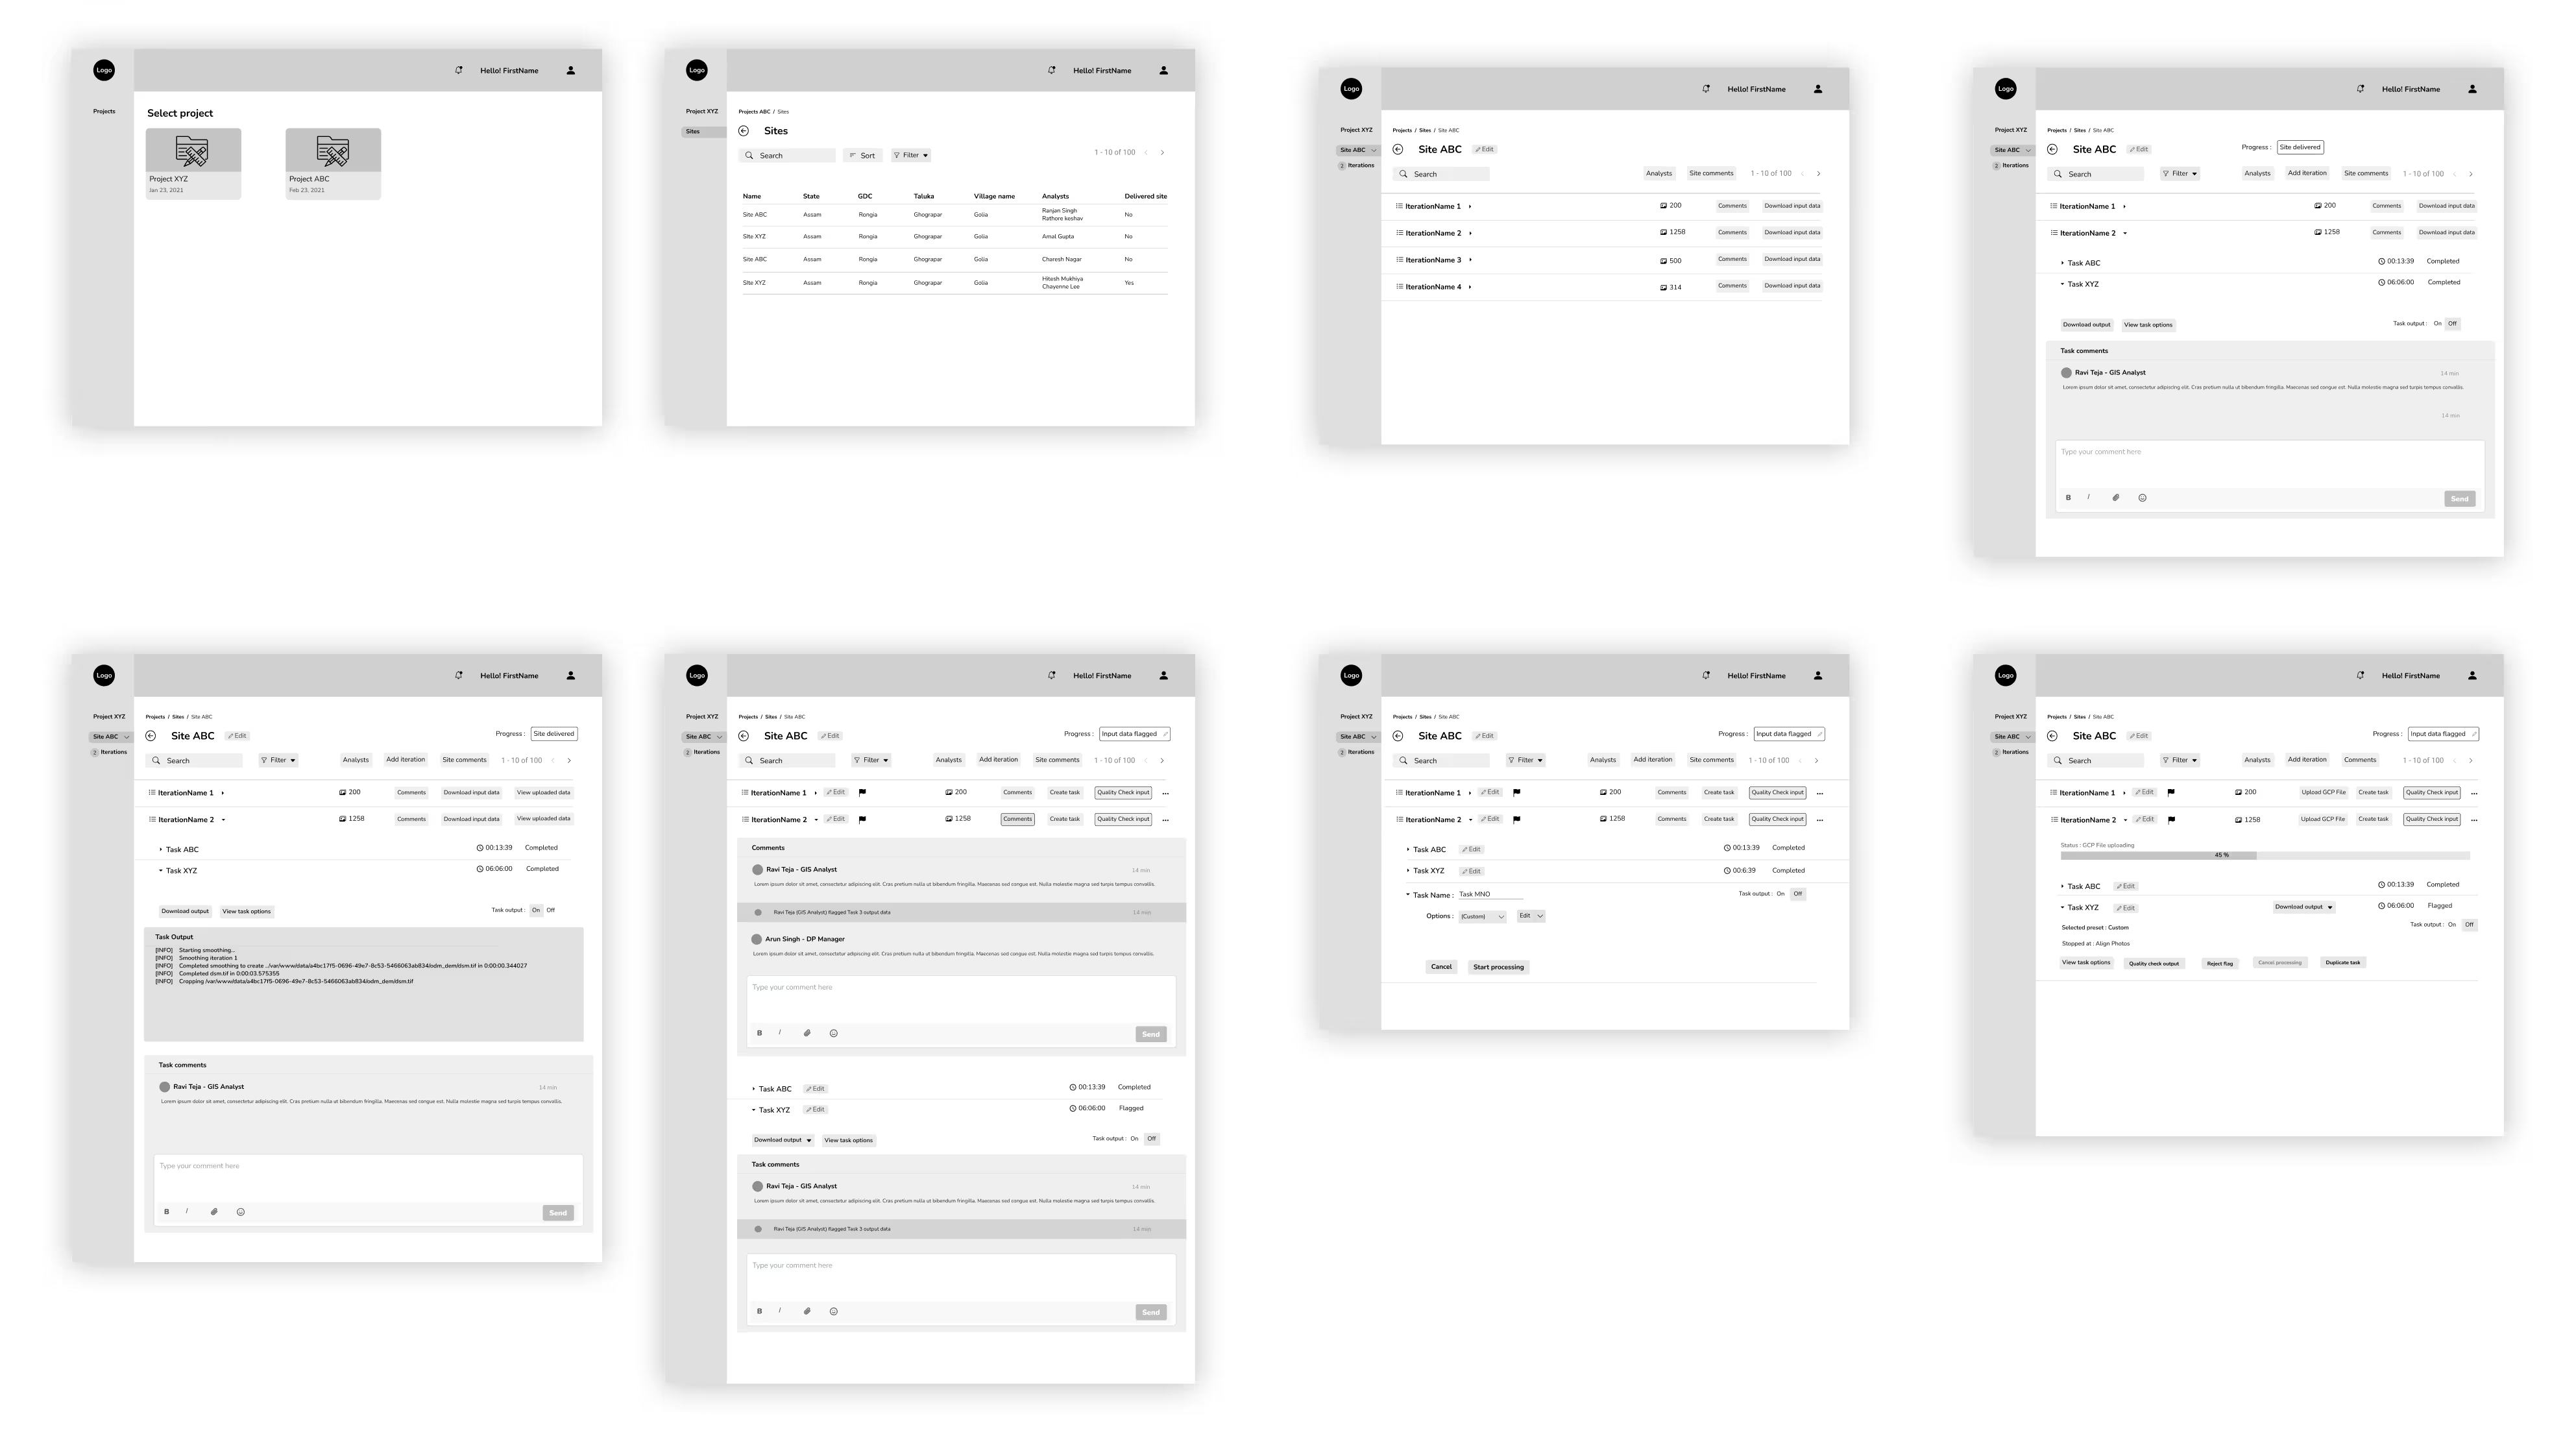
Thereafter, wireframes were designed and prototyped in order to outline and test various design ideas with the internal users. These went through 2 rounds of iterations based on feedback from the testing sessions.
High-fidelity designs & Design System
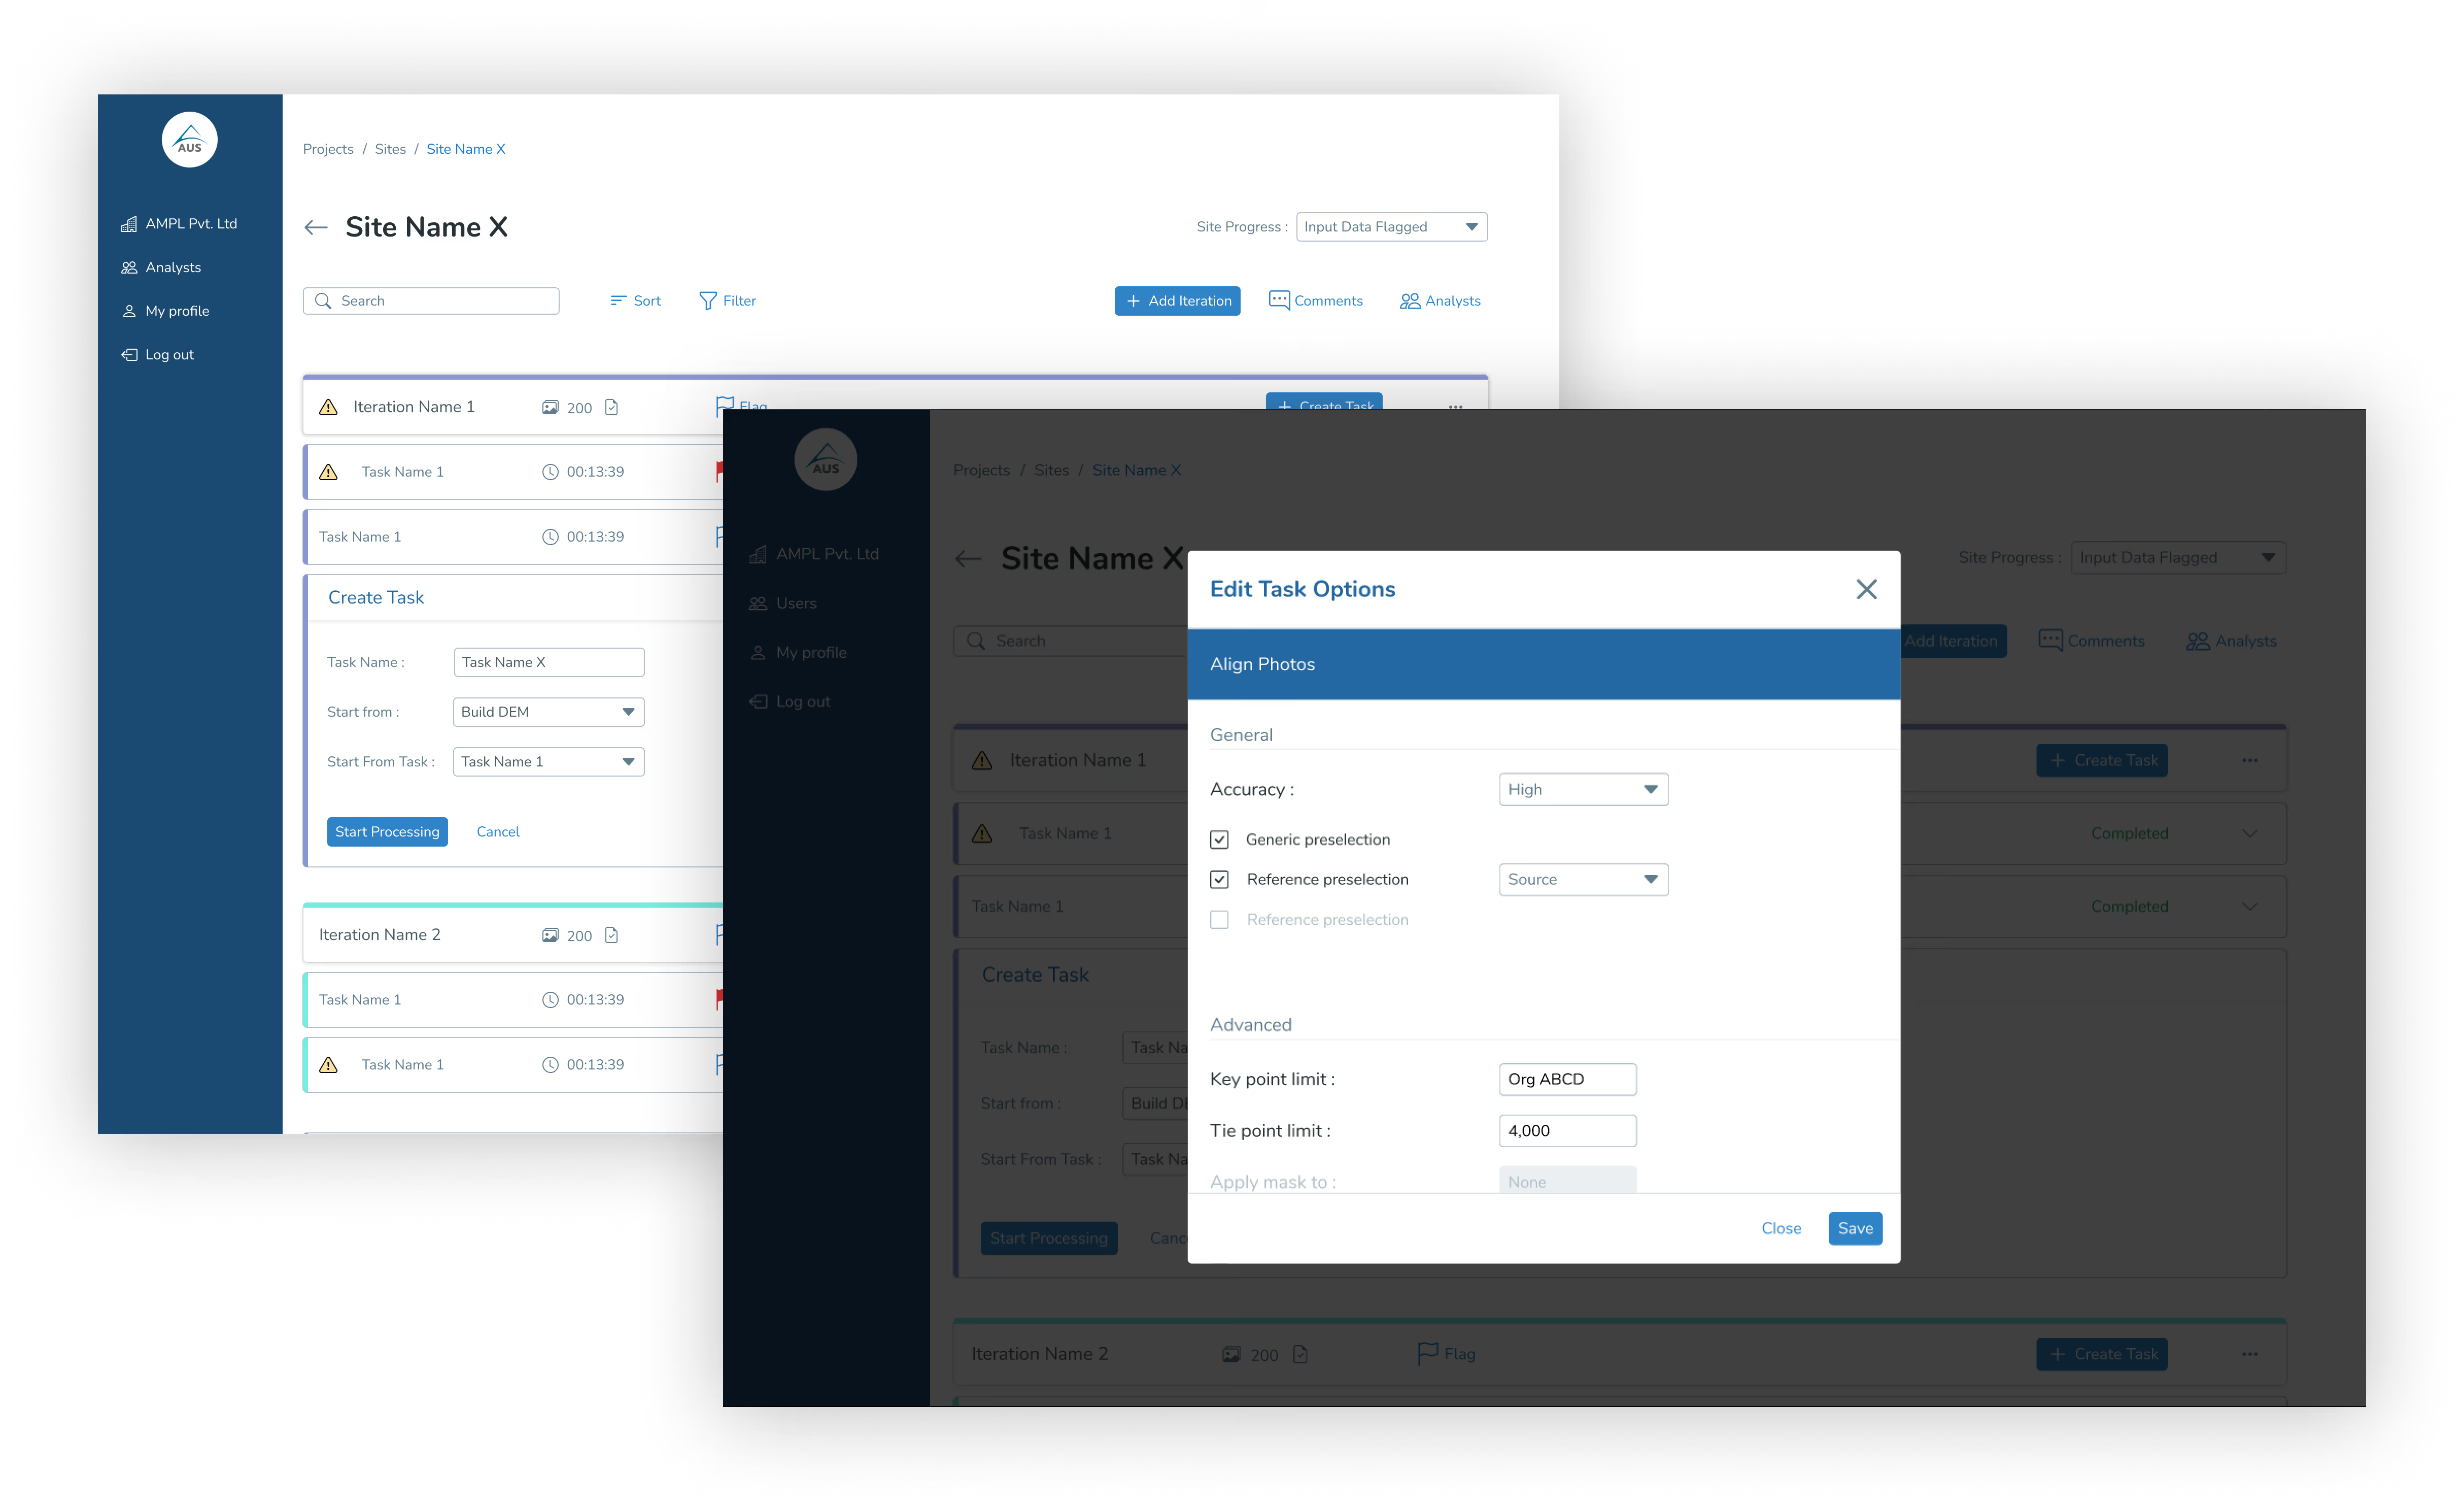
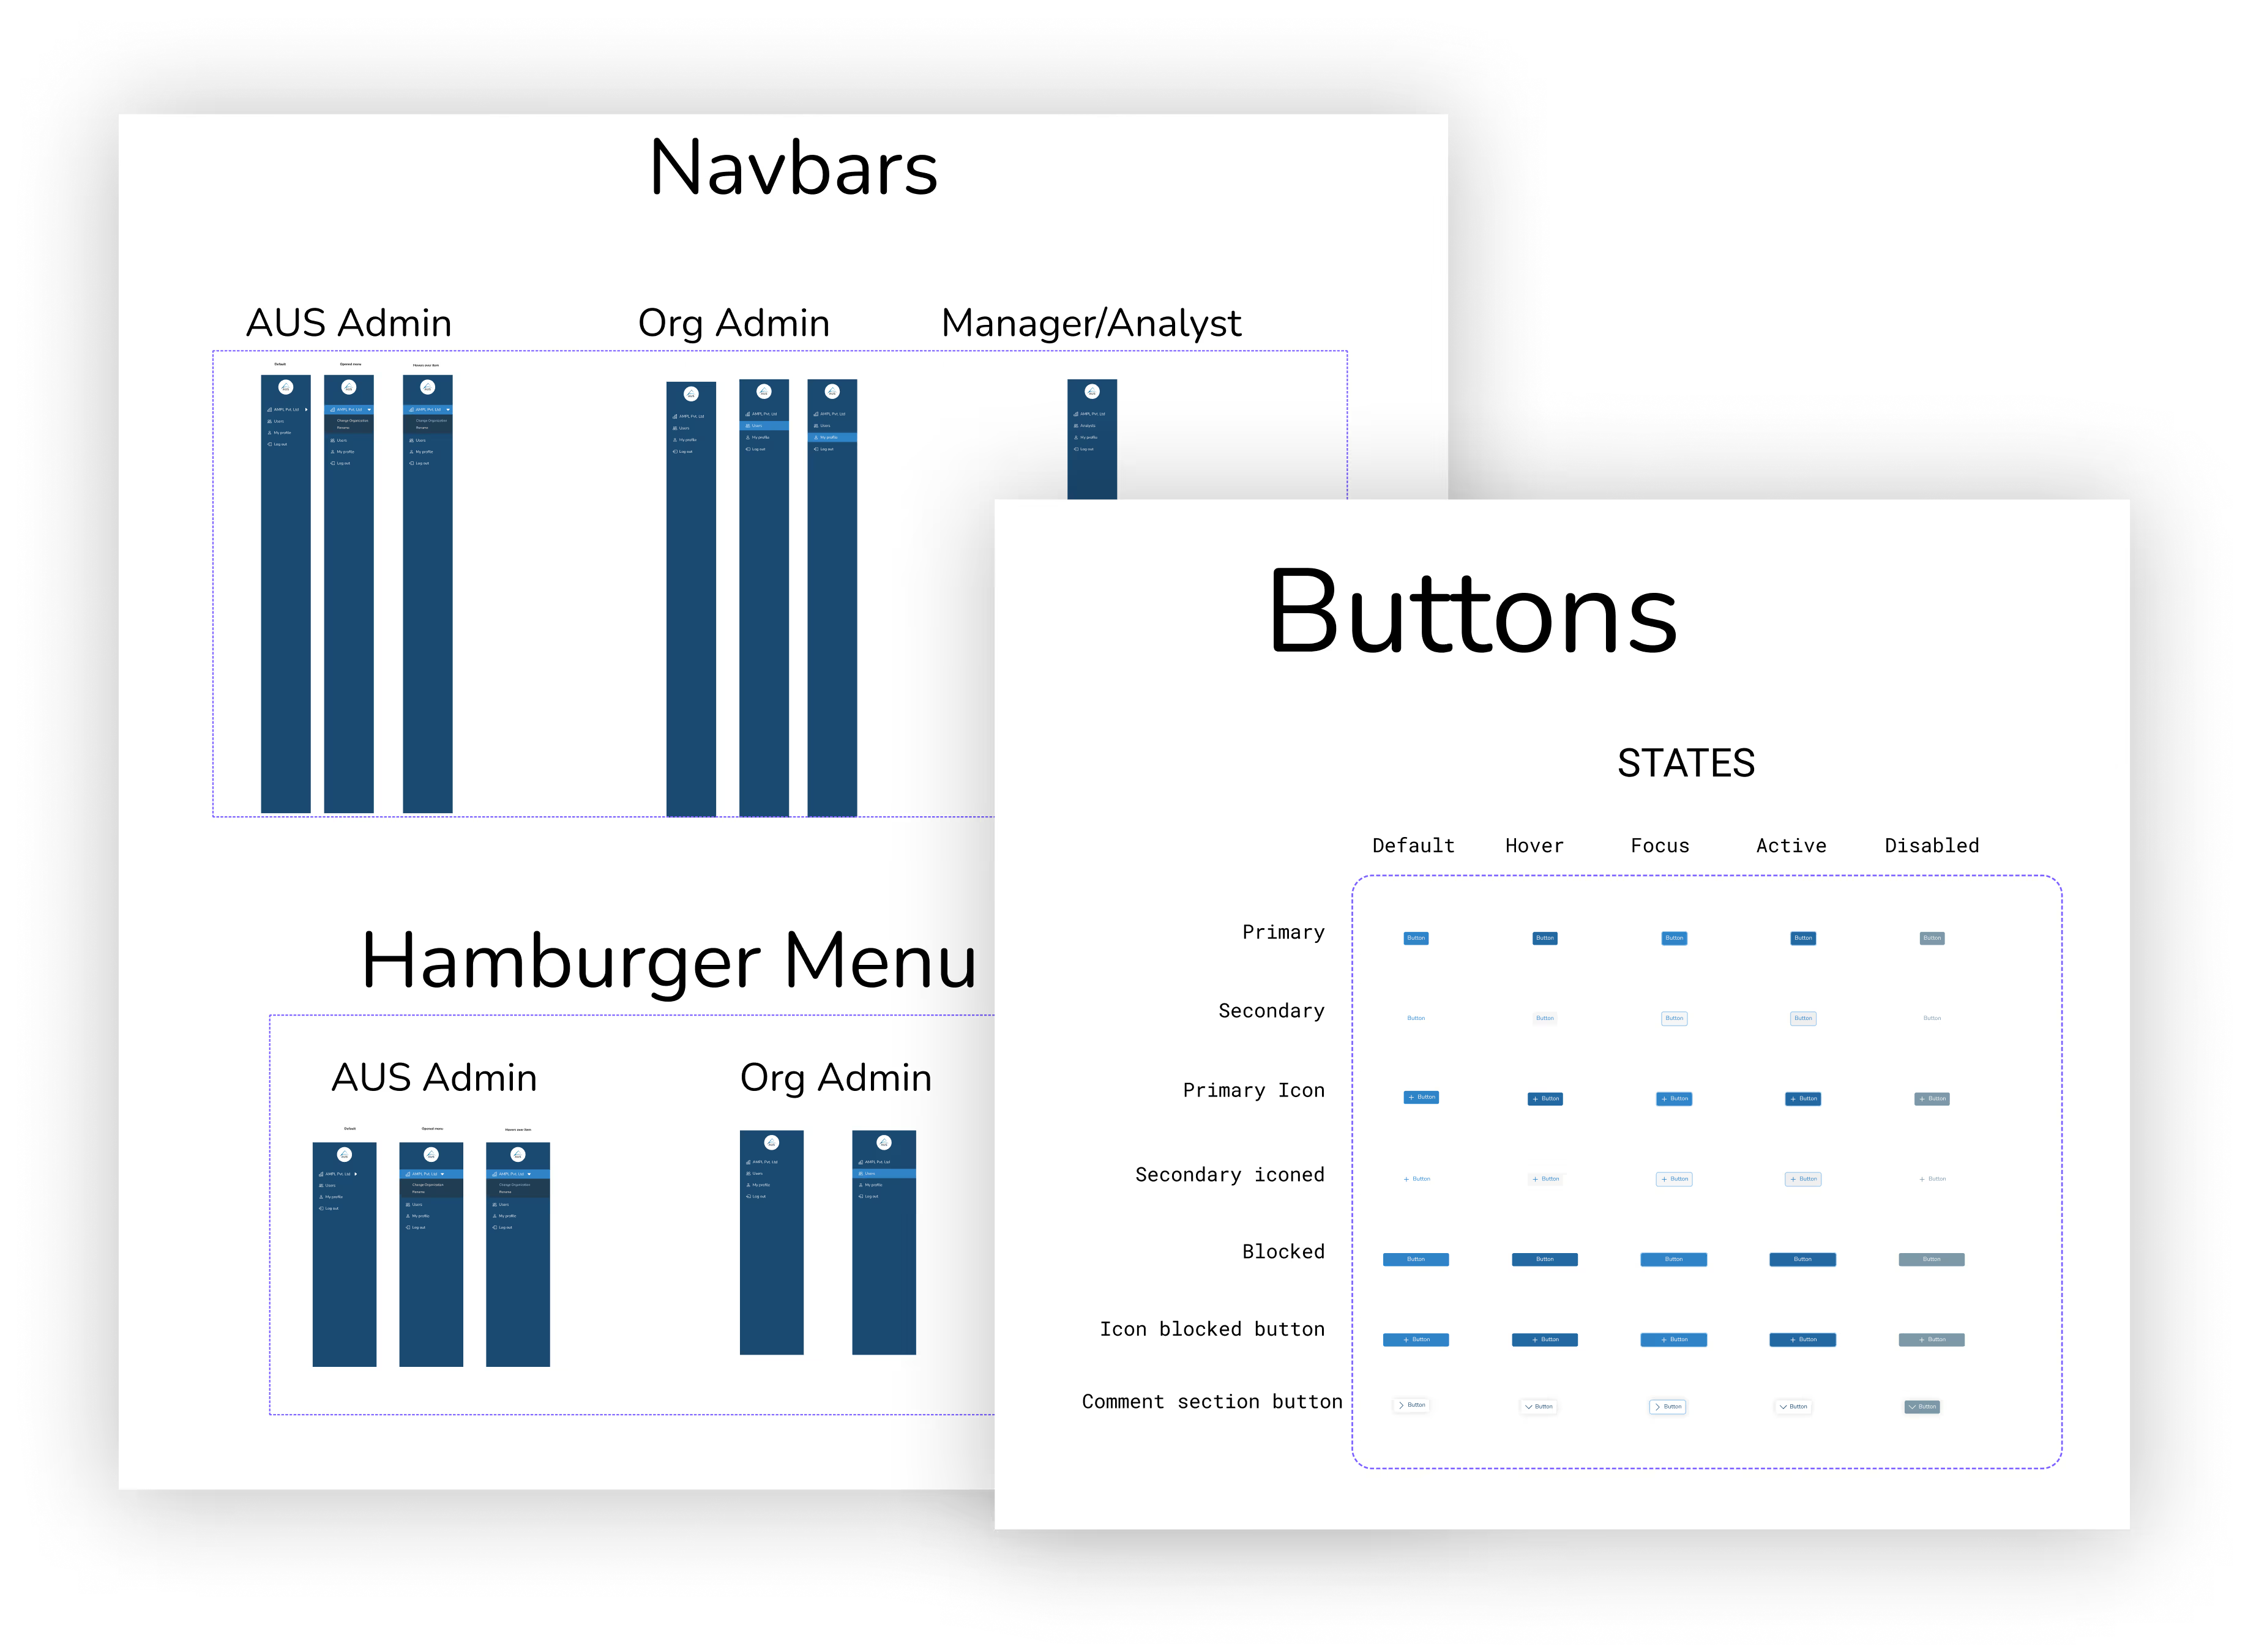
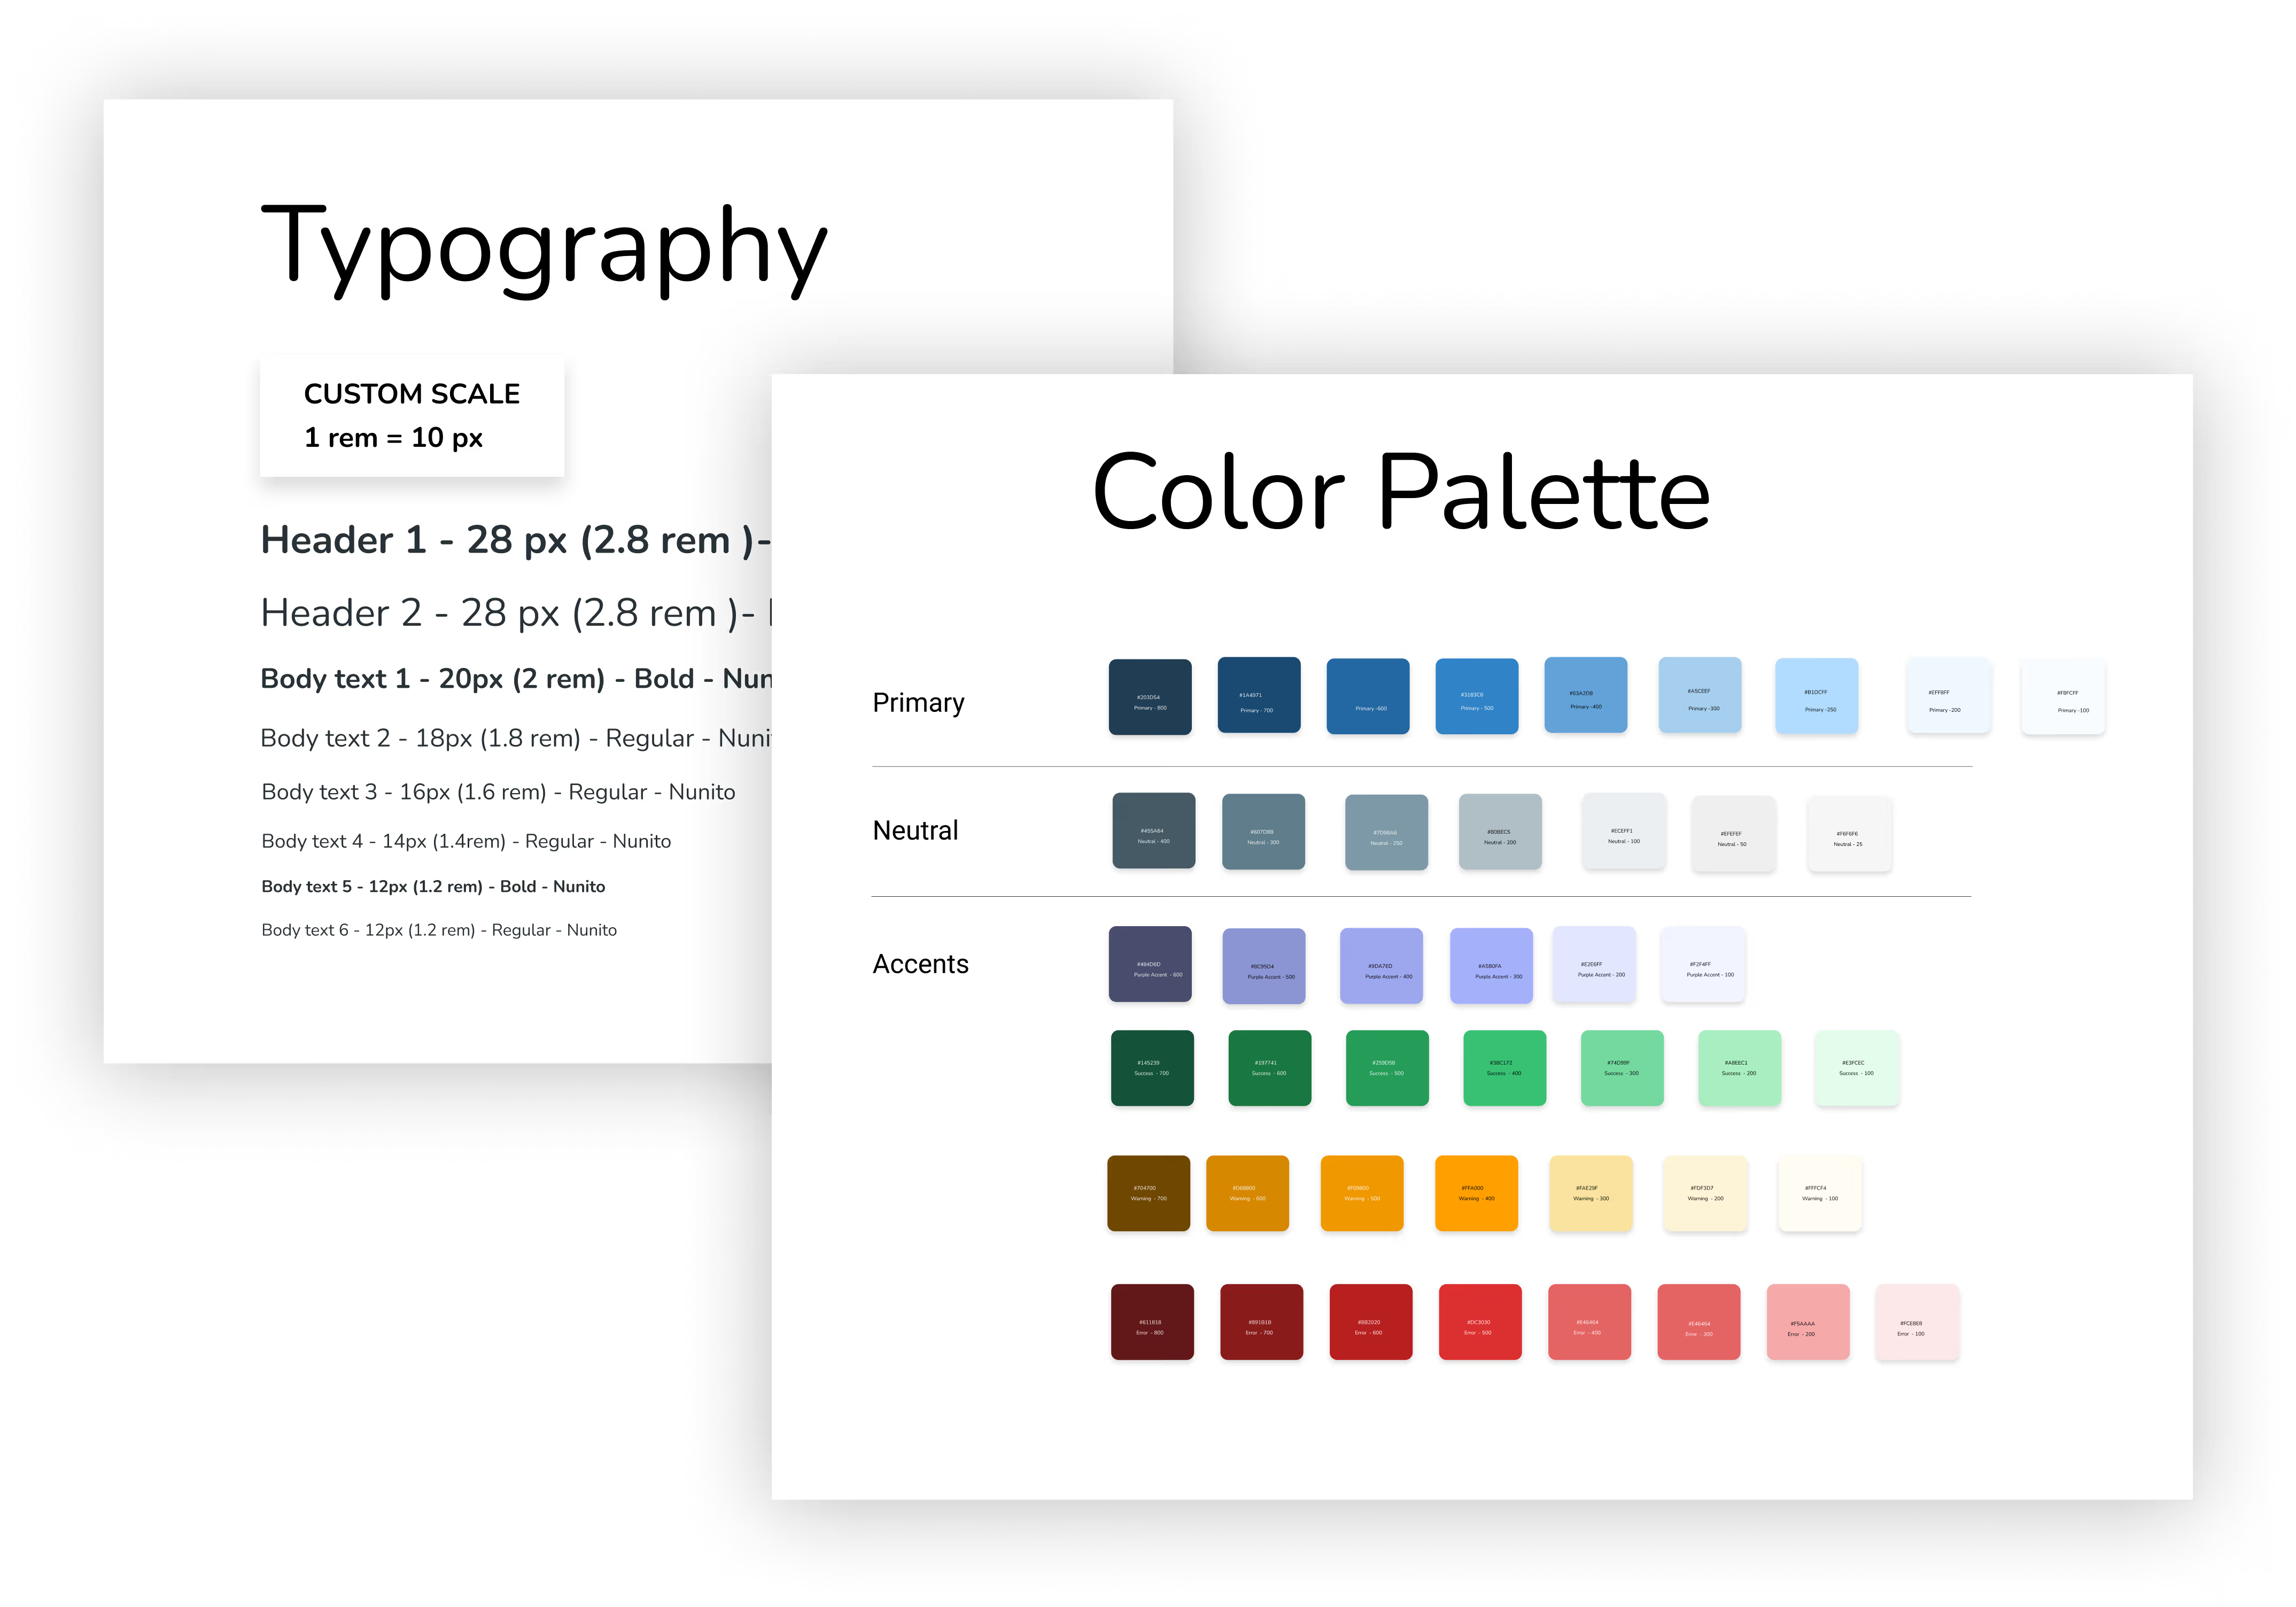
After iterating on the wireframes, the final designs were created. Parallel to designing the screens, I also created a design system to maintain consistency among all the design elements and interaction patterns.
Delivering
Developer Hand-offs
Finally, I created hand-off flows and annotated the designs and their interactions, edge cases, different states and flows in a visual format, such that it was easily comprehendible by the developers and the broader team members. This was done in order to document and communicate the nuances of the designs.
Moreover, I recorded the prototypes of each task flow to further illustrate and communicate the complexities of each interaction.
Interested to know more about this project? Feel free to get in touch